The recent global outage caused by an update to CrowdStrike Falcon, CrowdStrike's endpoint detection and response (EDR) system has resulted in the registration of numerous lookalike domains. We suspect that many of these were registered by bad actors with the intention of using them for scams and/or malicious phishing campaigns.
Many lookalike CrowdStrike domains have been registered in the past 3 days.
Due to the suspicious nature of these newly registered domains, we recommend organizations monitor network activity to determine if any of their systems are communicating with these domains.
As these domains are created, Stamus Networks is adding these domains to the Newly Registered Domain (NRD) threat intelligence feed.
Stamus Security Platform provides for detection and escalation of Newly Registered Domains. Those are available by default to any Stamus Customer. Access the online documentation to verify that you have this feed enabled.
If you are not a current Stamus Security Platform user, the Newly Registered Domain (NRD) threat intelligence feeds are available here. All six NRD feeds are free and optimized for SELKS and Suricata 7 users. To learn more about NRD threat intelligence, read our blog post "Introducing Open NRD: Newly Registered Domain Threat Intel Feeds for Suricata".
Please find below examples of the recently registered suspicious (mostly with malicious intent) CrowdStrike-related domains:
crowdstrike24[. ]site
crowdstrike24[. ]online
thecrowdstrike[. ]com
thecrowdstrike[. ]com
thecrowdstrike[. ]com
crowdstrike[. ]blue
crowdstrike[. ]bot
crowdstrike[. ]cam
crowdstrike[. ]fail
crowdstrike[. ]help
crowdstrikeoutage[. ]info
crowdstrikedown[. ]site
crowdstrikereport[. ]com
crowdstrike-bluescreen[. ]com
crowdstrike-helpdesk[. ]com
crowdstrike-out[. ]com
crowdstrike0day[. ]com
crowdstrikebluescreen[. ]com
crowdstrikebsod[. ]com
crowdstrikebug[. ]com
crowdstrikeclaim[. ]com
crowdstrikeclaims[. ]com
crowdstrikeclassaction[. ]com
crowdstrikedoomsday[. ]com
crowdstrikedown[. ]com
crowdstrikefail[. ]com
crowdstrikefixer[. ]com
crowdstrikeglitch[. ]com
crowdstrikelawsuit[. ]com
crowdstrikeold[. ]com
crowdstrikeoops[. ]com
crowdstrikeoopsie[. ]com
crowdstrikeout[. ]com
crowdstrikeoutage[. ]com
crowdstrikerecovery[. ]com
crowdstrikesucks[. ]com
crowdstrikesuporte[. ]com
crowdstriketoken[. ]com
crowdstrikeupdate[. ]com
crowdstrikewindowsoutage[. ]com
crowdstrikezeroday[. ]com
fix-crowdstrike[. ]com
fuckcrowdstrike[. ]com
fuckingcrowdstrike[. ]com
iscrowdstrikedown[. ]com
isitcrowdstrike[. ]com
microsoftcrowdstrike[. ]com
suportecrowdstrike[. ]com
whatiscrowdstrike[. ]com
crowdstrike[. ]feedback
crowdstrikehelp[. ]info
crowdstrikeplatform[. ]info
crowdstrikesupport[. ]info
crowdstrikerescue[. ]org
crowdstrikeyou[. ]xyz
crowdstrike-fix[. ]zip
crowdstrikefix[. ]zip
DETECTION AND ESCALATION
Please follow the steps listed below in the Stamus Security Platform (SSP) “Hunt” interface.
Create a Filter
NOTE: Portions of this are not applicable to the Stamus Probe Management license tier.
To create a filter:
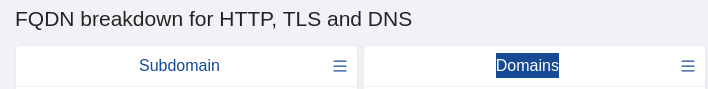
- 1. In Hunt, click on the magnifying icon next to any
Domain in FQDN breakdown for HTTP, TLS and DNS ( Dashboard tab).
- 2. Example:
-
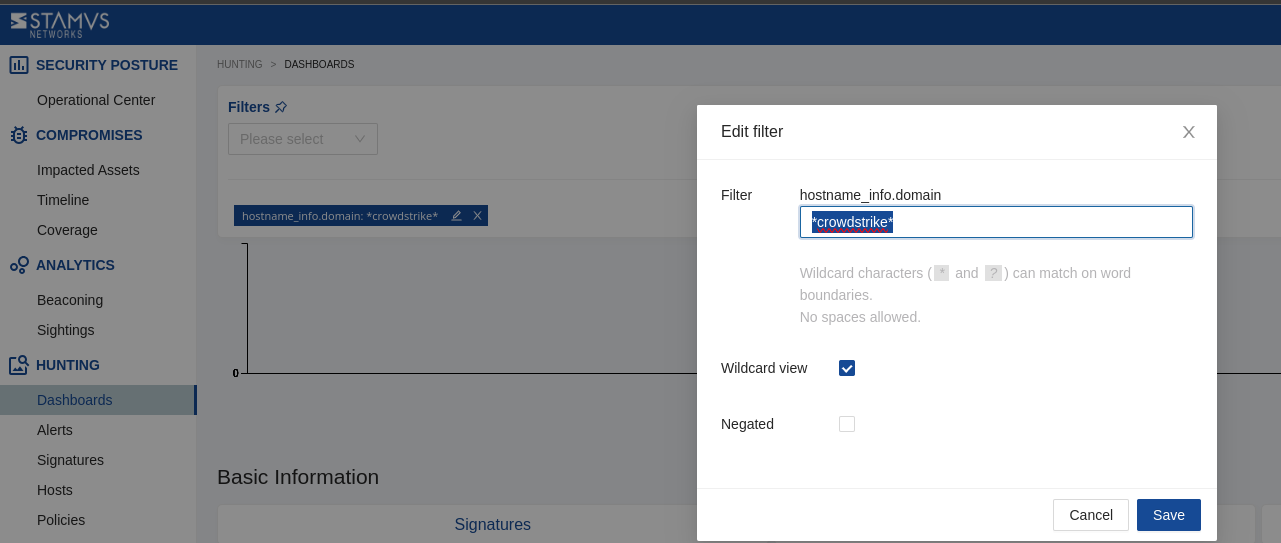
- 3, Click on the pencil/Edit icon on the resulting filter displayed as “Active Filters:”.
- 4. Type *Crowdstrike* or *Falcon* (Not all will be related to Crowdstrike)
- 5. Select the checkbox “Wildcard view”
- 6. Click Save
- 7. The result should be identical as on the screenshot below:
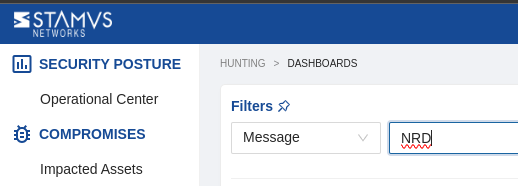
- 8. Add another filter for Newly Registered Domains
- 9. From the drop down menu in Hunt, select Filter-> Message and type in “NRD”, click Save.
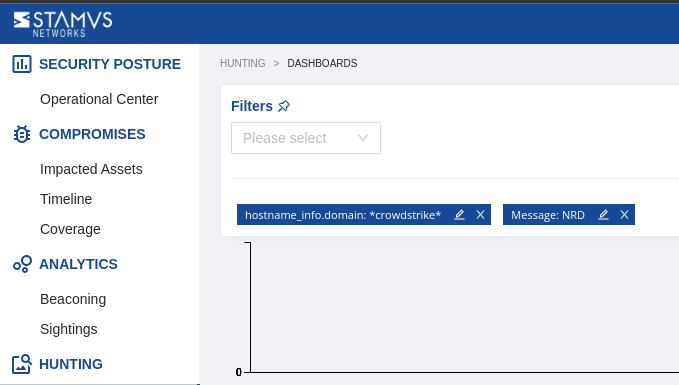
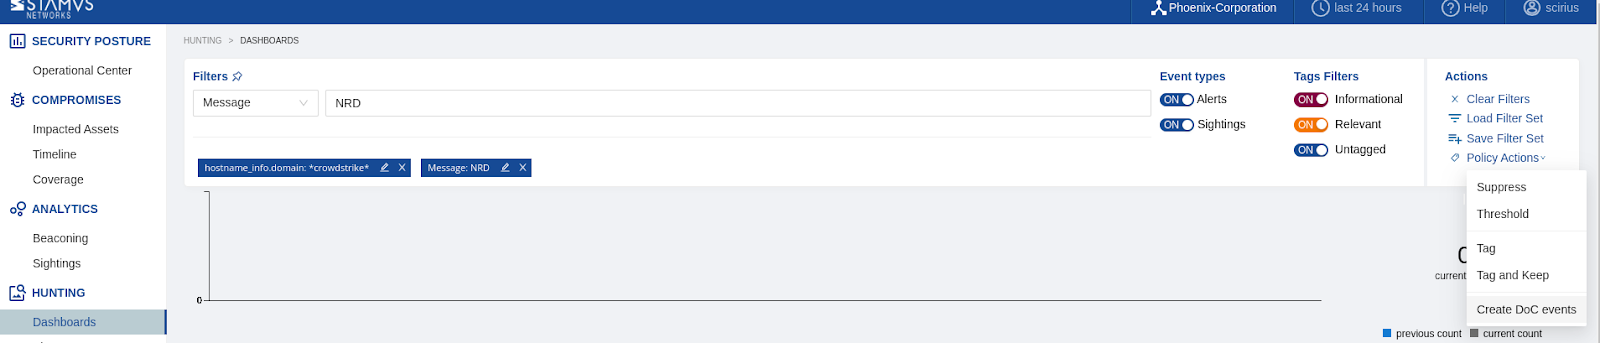
- 10. The resulting filter combination should be as follows
11. You are now ready to review the results and events in the Dashboard,Host Insights and Alert views.
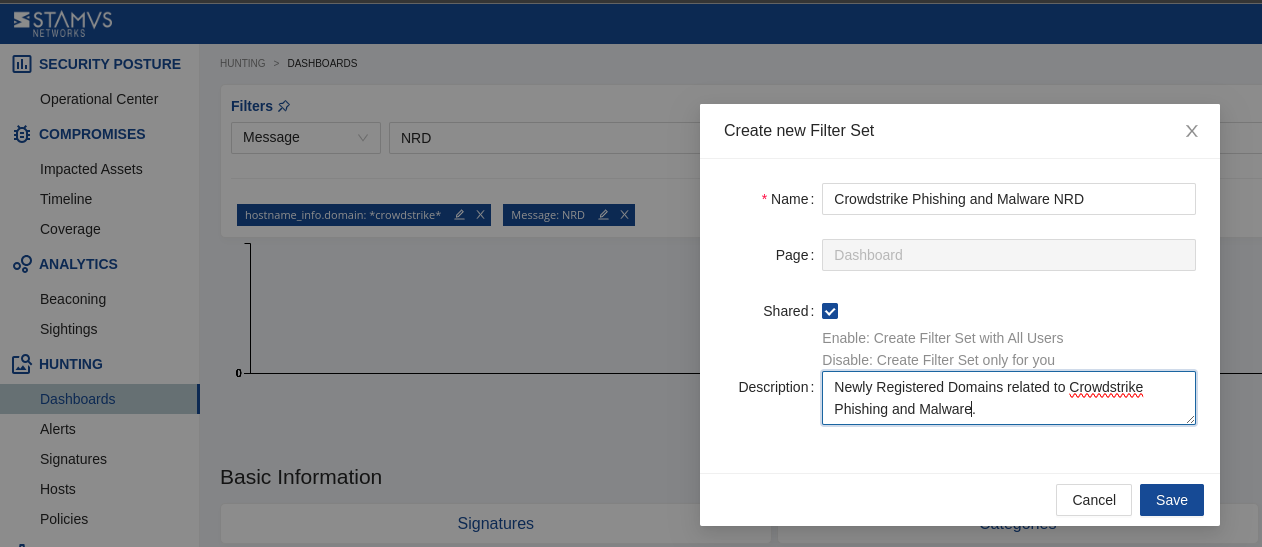
Save the Filter
NOTE: some items described here are not applicable to Stamus Probe Management license tier
The resulting filter can be saved by simply clicking on the “Save” link on the right-hand side of the “Active filter”. Check “Shared” in the resulting dialog box if you want to make the filter available to all users.
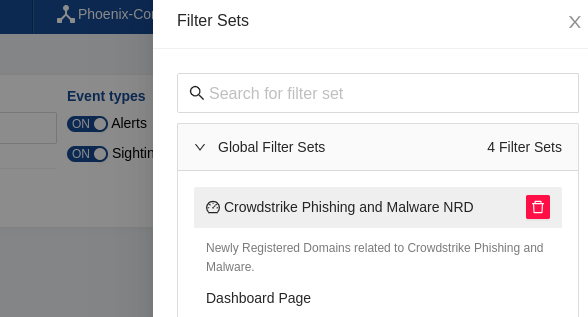
The newly created filter is now available in “Global Filter Sets” or “Private Filter Sets”
Automated Escalation and RestAPI Notification
NOTE: Portions are not applicable to Stamus ND or Stamus Probe Management license tiers.
If needed, an automated escalation to a Declaration of Compromise (DoC) and webhooks is also possible, including from historical data.
For example, if it happened 24hrs or 7 days ago it will still be detected and escalated based on that custom filter.
To do so:
- 1. After creating your filter as above
- 2. From the right-hand side drop down menu, Policy Actions, select “Create DoC events”.
- 3. Choose the plus (+) next to the Threat: Name
- 4. Fill in the Threat Name, Description, and Additional information.
- 5. Enter an Offender Key (i.e. src_ip)
- 6. Enter an Asset Key (i.e. dest_ip)
- 7. Leave Asset Type “IP”
- 8. Set a Kill Chain phase (i.e. Exploit)
- 9. Select “Generate DoC events from historical data”. [This will make sure historical events are also checked]
- 10. If desired and webhooks are setup also select “Generate webhooks events from historical data”
The screenshot below shows the DoC event creation form:
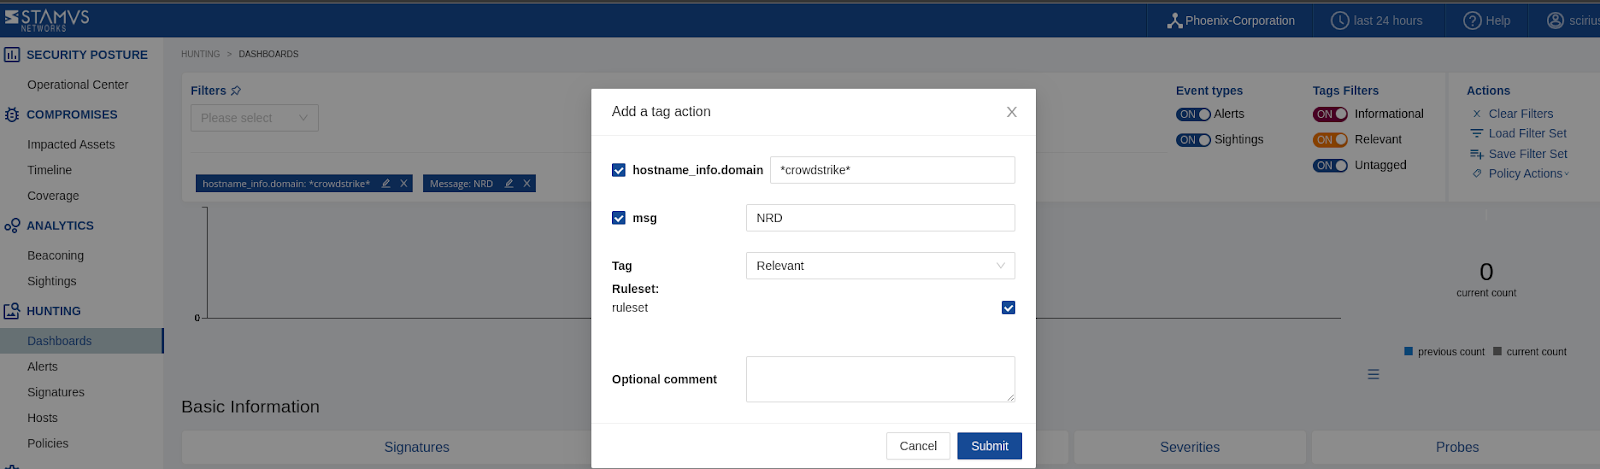
Automated Classification and Tagging
Auto Tagging all relevant events is also an option. This will allow for any logs (alerts or protocol transaction events related to the alerts) to have a “Relevant” tag inserted in the JSON logs:
To do so:
- 1. After creating your filter as above.
- 2. From the right-hand side drop down menu - Policy Actions , Select “Tag”.
- 3. Add in an optional comment and select a ruleset.
- 4. Update the threat detection (upload button in the middle of the top bar on the Hunt page, on the left-hand side of History, Filter Sets )
Export Data - SIEM / Elasticsearch / Kibana
All data generated by Stamus ND/NDR, such as alerts, protocol transactions, sightings events or HostID information, may be exported and shared with any SIEM or SOAR system.
Over 4000 fields are available -- from domain requests, http user agents used, hostnames, usernames logged in -- to encrypted analysis including JA3/JA4/JA3S fingerprinting, TLS certificates and more.
Any query of the Stamus Networks data (protocol transaction or alert logs) can be exported via a regular JSON log query or visualization export.
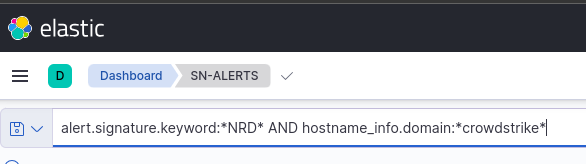
Example of Kibana query on alert events
To export CSV data from any info of the alerts you can open the SN-ALERT dashboard in Kibana, type in the filter:
“alert.signature.keyword:*NRD* AND hostname_info.domain:*crowdstrike*”
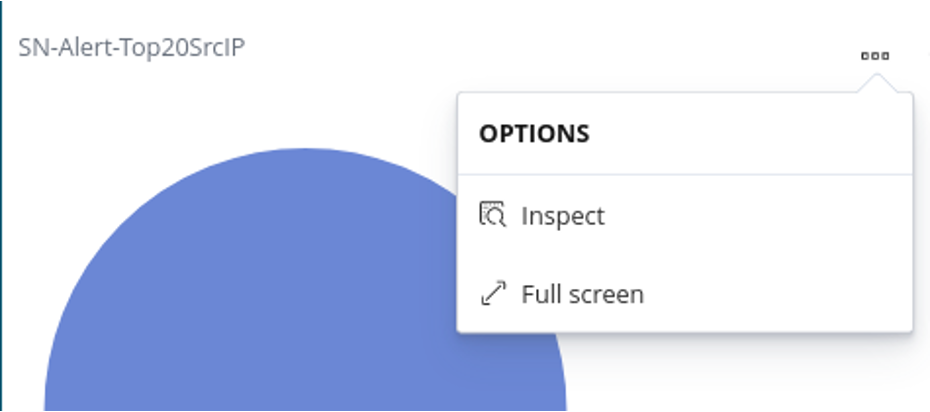
then you can export a CSV of any visualization using “Inspect” (see example below):
Click on “Inspect” in any visualization to export a CSV
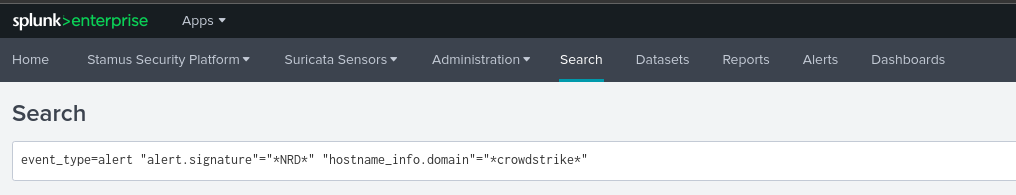
Export Data - Splunk
NOTE: portions of this section are not applicable to Stamus Probe Management.
Any query of the Stamus Networks data (protocol transaction or alert logs a like) in Splunk can be exported via a regular Splunk query or visualization export.
Example of a Splunk query on alert events
event_type=alert "alert.signature"="*NRD*" "hostname_info.domain"="*crowdstrike*"
Protocol transactions
Stamus Networks provides a free Splunk app https://splunkbase.splunk.com/app/5262 that can be used to do specific searches.
If there are any Splunk visualizations queries that have supporting information for the query that needs to be exported, it can be done so by the native Splunk export functionality.
Troubleshooting and Help
Please feel free to reach out to support@stamus-networks.com with any questions or feedback.
To stay updated with new blog posts from Stamus Networks, also make sure to subscribe to the Stamus Networks blog, follow us on Twitter, LinkedIn, and Facebook, or join our Discord.