Today I want to give you a brief tour of what’s new in Update 38 of the Stamus Security Platform (or “U38”).
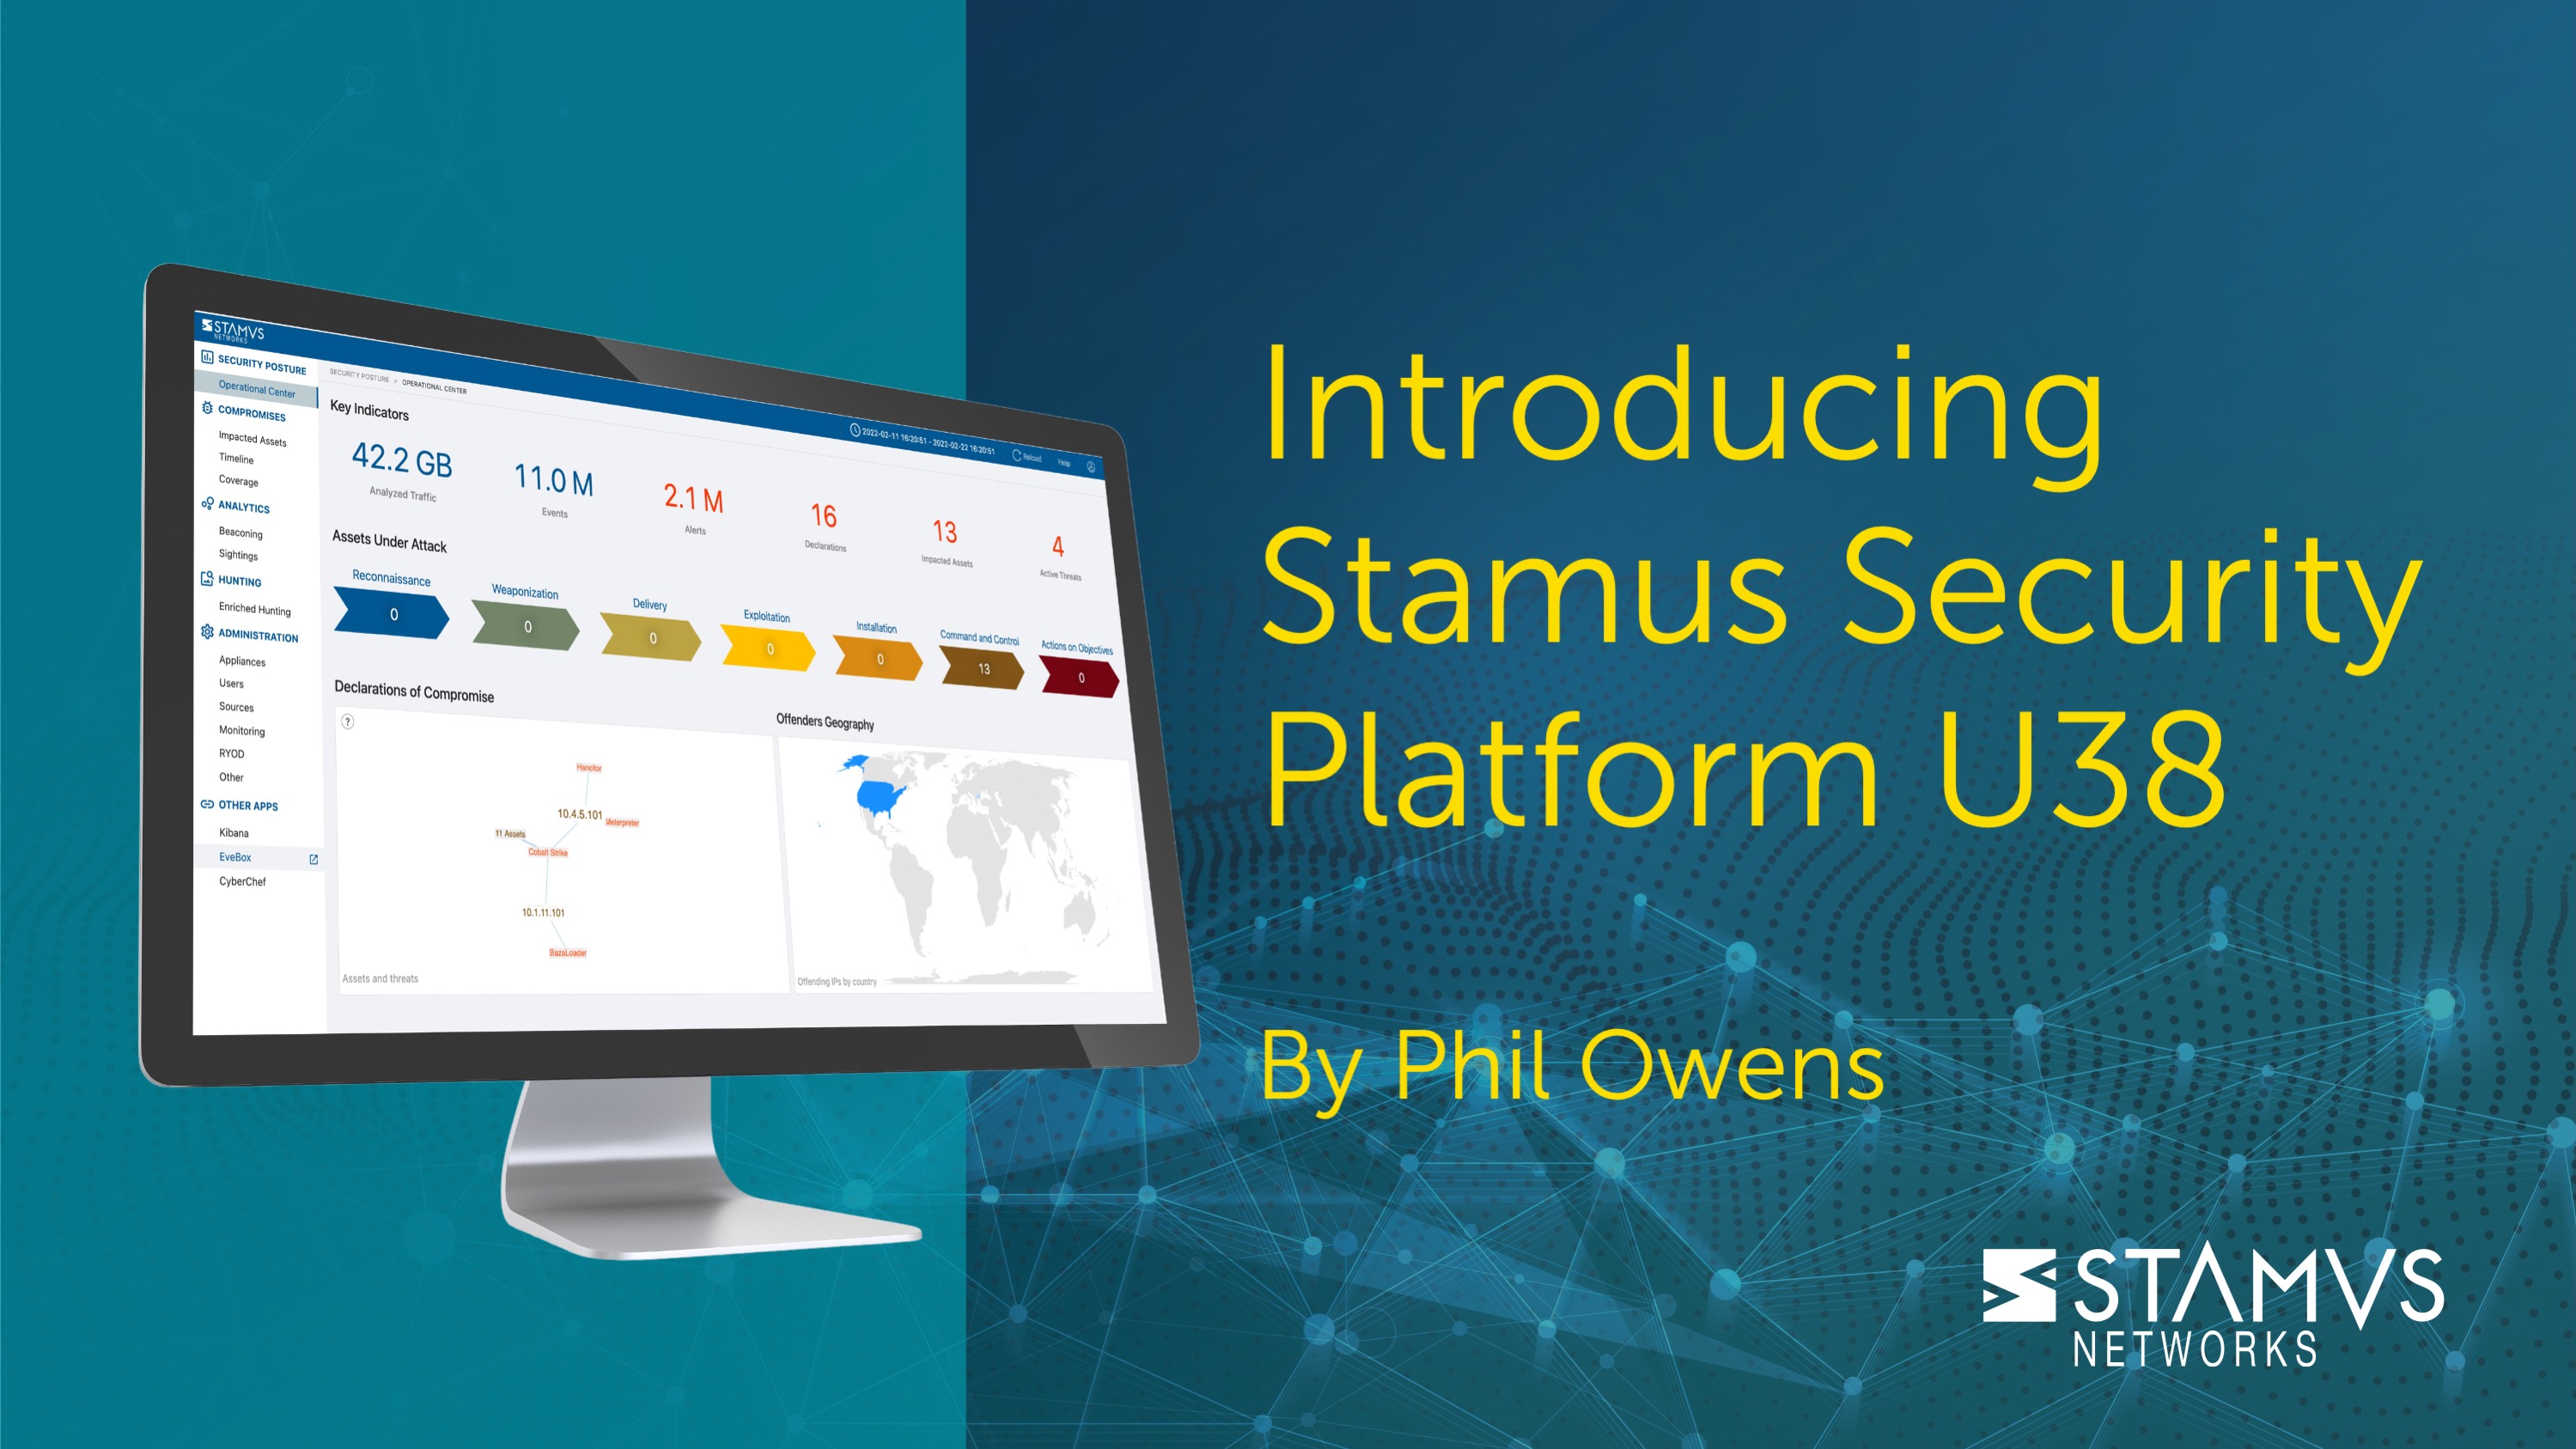
In U38, we begin the transition to a new user interface designed to help make SSP easier to use and understand. And the update is better representative of the two license tiers. Below I have attached a screenshot of the new user interface changes for users of the Stamus Network Detection and Response (Stamus NDR) license tier which is where the UI changes will first be noticable. In subsequent releases, we will unify the user experience for the functions available only in Stamus Network Detection (Stamus ND) and Stamus Probe Management (Stamus PM) license tiers.
Ok. Now onto the new features in U38.
TLS Beacon Detection (Stamus NDR)
With U38, we introduce beacon detection over TLS for complex command and control architectures. This machine learning algorithm allows SSP to quickly detect possible beaconing activity that would otherwise go undetected.
The Stamus NDR UI includes a link on the left hand navigation pane for“beaconing” that takes the user to a screen that displays all serving IP addresses and JA3S hashes. The data is scored in a beacon metric that conveys the likelihood that the communication is a beacon. The beacon metric is a range from 0-100 and the higher the metric the more likely the communication is a beacon.
When the user clicks the more info link on the right of a potential beacon that will go to the following page. This page includes most of the information needed to determine if a beacon needs investigating further in the hunting interface.
Sightings for new traffic (Stamus NDR)
Sightings represent detection of newly discovered metadata. This anomaly detection algorithm identifies the initial occurrence of never-before-seen data, allowing for a quick view of new connections based on domains, user agents, JA3/JA3S, TLS SNI/subject/serial/issuer, HTTP Server, SSH client/server version, and SMB executable files.
In U37 we introduced a beta version of this feature using dynamic datasets. U38 enhances this feature by splitting the assets into roles (see below). The system can then continuously evaluate connections and traffic patterns for Domains, User Agents, JA3/JA3S, TLS SNI/Subject/Serial/Issuer, HTTP Server, SSH Client/Server version, SMB Executable files in order to identify new values, never before encountered. When combined with critical assets, this “newly discovered” event can be used to detect anomalies and otherwise unknown threats.
Here’s a little bit more about the use cases for this feature:
This information can be found in the new NDR user interface and with a switch on the Enriched Hunting UI.
Once properly configured, this Sightings data, associated with network definitions and business context, can be used to quickly spot potential issues, including threats and/or potential misconfigurations.
For example, usually the servers being monitored communicate with the same set of destinations. However, if that server starts communicating with something new, it could signify suspicious activity, like a change in a software update server. This could be non-threat related, but it may also represent a redirect to someplace malicious as would occur in a typical supply chain chain attack (think Sunburst).
These sightings may also be applied retrospectively on threat intelligence that come during an investigation or are given by a third party. As the list of metadata fields tracked by the sightings database grows, most provided IOCs are searchable and this is possible without the system retaining the actual protocol transaction logs. This approach saves tremendously on storage resources. The downside of this approach is that the system won’t be able to uncover the full extent of the IOC usage. But you will nonetheless be able to identify the patient zero.
File Extraction (Stamus ND and NDR)
Suspicious file capture and extraction was also added to U38. Files associated with alerts can be captured for download using the Enriched Hunting interface, enabling the analyst to extend the investigations using third party tools and sandboxes.
When turned on this feature will save files on the local probe disk based on rules that have been coded with the keyword “filestore.” When saved, they will be de-duplicated based on the SHA256 hash of the file. These files are then available to the analysts during an investigation in the hunting interface under the alert that fired:
Notice the link on the right hand side of the files tab for the alert.
These files can be retrieved by a third party application such as a SOAR or sandbox through an API call and used to capture evidence about an incident or perform malware analysis.
For more information on this feature and how to make the API call please see the product documentation for “File Extraction” here: https://docs.stamus-networks.com/administration/file-extraction.html
User Interface Changes
You will notice a new “NDR” option on the main home screen and in the application switcher (shown below). This option replaces what was previously known as Threat Radar. All the capabilities that were in Threat Radar are available under the new NDR option.
The biggest change you will see is when you click on NDR. This is the first iteration where we are moving to a single interface for the platform. We have also moved some items to the foreground that were hidden behind multiple clicks like the attack timeline (formally known as the “Kill Chain Timeline” under “Assets”). You will also notice that we have broken out some key indicators in the Operational Center (formally called Dashboard). Here is a description of what each indicator means:
- Analyzed Traffic - The amount of traffic that has been processed by the probes.
- Events - The number of flow and network protocol events that have been created from the traffic.
- Alerts - The number of alerts that were fired from the events created.
- Declarations - This is shorthand for “Declarations of Compromise” that were detected from the various detection mechanisms . A declaration of compromise represents a high confidence threat on a given asset.
- Impacted Assets - the number of IP addresses, email addresses, or usernames that are impacted by the threats.
- Active Threats - The number of unique threats that are impacting assets in the environment.
This display, like most in the system, reflects the data in the system for the time window selected/shown in the top right of the header. You can choose a relative time window of between 1 hour and all time or you may select an absolute time frame to review.
You can see the all new beacon detection and sightings features that we talked about earlier located on the left hand navigation panel under the “Analytics” heading.
Ruleset Versioning (All license tiers)
Ruleset version management with revert and freeze were added in U38. Reverting allows the administrator to roll back to a previously known good ruleset if one or more rules are found to be adversely impacting performance. Freeze lets the administrator halt ruleset updates while troubleshooting and unfreeze when the faulty rule(s) are foun
Stamus Security Platform retains the 20 latest rulesets. And when Stamus Network Probes use a rolled-back version of a ruleset, they automatically enter a Frozen state which implies that no scheduled tasks will run until the Stamus Network Probes are set back to the most current ruleset.
Enhanced Declaration of Compromise Timeline (Stamus NDR)
In version U37 we introduced a Declaration of Compromise Timeline (formally known as the Kill Chain Timeline). This timeline could be helpful in tracing back to a patient zero when an attack took place. It showed you all the threats and killchain phases that an asset was experiencing and plotted that into a gantt chart. It also let you drill into a timeline to allow you to see when an asset moved to a different phase of the kill chain.
With U38, the attack timeline has been augmented with evidence from Host Insights. The Declaration of Compromise attack timeline now includes Sightings detections and details about the offending and offended hosts, making it easier for the analyst to identify the details behind the attack and why SSP declared the compromise. See below.
This feature gives the analyst better visibility into anomalies that have taken place on both sides of threat movement in the killchain.
Asset Roles (Stamus NDR)
With U38, SSP automatically identifies the role a host plays in the network. The currently supported roles include Domain Controllers, DHCP Servers, Printers, and Proxy Servers. These roles are determined automatically by the traffic that is seen accessing these assets. The asset role will be viewable in the Sightings and Timeline screen of NDR as well as in the Host Insights (Hosts) when available in the Hunting interface. This addition of asset roles will be useful for analysts while doing investigations to understand the type of asset they are looking at.
For those customers using a 3rd party SIEM like Splunk this data will be delivered as host_id.roles.
Additional Features for Native Suricata Sensors
In U38, we improved the organizational context from the network definitions that is available for native Suricata sensors. The Network Definitions that allow SSP to enrich events with organization-specific context are now available when native Suricata sensors are deployed as part of the system, providing analysts with that business context during an investigation. Previously this feature was only available with Stamus Network Probes.
Tested at NATO Cyber Exercises
It is important to mention that the content of U38 incorporates feedback from and our improved detection has been tested in our annual participation in the world’s largest and most complex international live-fire cyber defense exercises – NATO Cooperative Cyber Defense Center of Excellence (CCDCOE) Locked Shields and Crossed Swords. Where Stamus is a proud supporter and participant for the last 5 years.
The emphasis of these exercises is on advanced threat actor (APT style) detection and defense communication / integration betwenthe defending teams.
Let us help
As always, our team is eager to share more details about this new release. So, please let us know your availability to discuss the U38 upgrade and - if you’d like - to schedule a brief demonstration of these new capabilities.
If you are a current customer, you may visit your My Stamus Networks portal to review the instructions for upgrading your Stamus Security Platform, including your Stamus Network Probes to U38.
Finally
This blog is not complete without a big shout out to the great Development and Quality Assurance teams here at Stamus Networks. These are the unsung heroes of any software company. They make releases like this possible. Please join me in thanking them for making U38 a reality!


