Are you looking to improve your threat hunting and network based forensic analysis skills with Suricata? Look no further than the Open Source SELKS SN-SANS-MTA-Training dashboard. In this blog post, we'll walk you through how we used this powerful tool to solve the June 2021 forensic quiz, and how you can use it to enhance your own investigations.
Any and all data in our blog is produced from the publicly available PCAP and ran through Suricata.
Forensic Analysis with the SELKS SN-SANS-MTA-Training Dashboard
Suricata is a high performance, open source network analysis and threat detection software used by many private and public organizations, and embedded by numerous major vendors to protect their assets. SELKS, created by Stamus Networks, is an open source, turn-key Suricata-based intrusion detection (IDS), network security monitoring (NSM), and threat hunting system.
Suricata generates network protocol, flow, and anomaly logs on top of being able to do file extraction and PCAP logging - regardless of alerts. As a matter of fact, alerts are usually 1-5% of the total data Suricata produces. Because of the inclusion of the Suricata engine, SELKS enables users to complete complex forensic analysis, which is exactly what we will be showcasing in this blog.
Forensic analysis can be a complex and time-consuming process, but the SELKS SN-SANS-MTA-Training dashboard simplifies the task by providing a comprehensive set of visualizations and tools in a single view. In this article, we will exhibit our use of the dashboard in unraveling the June 2021 forensic quiz and illustrate how you can employ similar methods in your investigative procedures.
These key concepts can be used in solving other quizzes, more importantly they can be utilized in production, training, incident response, or investigation of how certain malware or malicious binary behaves.
Those concepts include visibility into the protocol and flow data produced by Suricata - , including the IP addresses, host names, and user account names of the infected Windows computers via SMB, KRB5, HTTP, DNS and TLS logging and alert metadata visualizations.
Additionally, we'll be providing the answers to the quiz including the exact date and time the infection activity began for each affected machine. Finally, we'll delve into the family of malware involved in each infection, so you can gain a better understanding of the nature of the threat. Keep reading to learn more about this interesting forensic challenge!
Solving the June 2021 forensic quiz with SELKS
Once we have SELKS installed we replay the PCAP like so:
scripts/readpcap.sh -ac June-2021-forensic-contest.pcap
More about how to install the docker version of SELKS on different Linux OS’s can be found here.
Questions from the challenge:
- IP addresses of the infected Windows computers.
- Host names of the infected Windows computers.
- User account names from the infected Windows computers.
- Date and time the infection activity began in UTC (the GMT or Zulu time zone) for each infected computer
- The family of malware involved for each infection.
The Kibana visualization SN-ALERT-Timeline-msg table as part of the SELKS SN-SANS-MTA dashboard represents alert data related to the monitored network traffic. The columns in the table provide the following information:
- alert.signature.keyword: Descending: This column shows the name of the alert signature that triggered the event. The "keyword" suffix is a way of indicating that the field is a string and is sorted in descending order.
- alert.target.ip.keyword: Descending: This column shows the IP address of the target that triggered the alert. This field can be different then src or dest ip. It simply represents what the actual target is, rather than src or dest IP of the alert log. This field is also a string and is sorted in descending order.
- First Seen: This column shows the date and time when the alert was first seen, in UTC.
- Last Seen: This column shows the date and time when the alert was last seen, in UTC.
- Count: This column shows the number of times the alert was triggered during the specified time period.
Overall, this table provides a first-seen breakdown timeline view of the different groups of malware involved during a specific time period, including the signature name, IP address of the target, and the duration and frequency of the threat. It can help SoC analysts and hunters identify security threats and investigate the timeline, time sequence of the different tooling, and/or malware involved in the infection.
Simply by looking at that table we can have an immediate view of what malware triggered when (or first) in a timeline.

This table can easily be used to find the answer to the first question from the quiz and in particular: What are the IP addresses of the infected Windows computers?
The answer to this question is visible from the "alert.target.ip" column on the table.
- IP address: 10.6.15.119
- IP address: 10.6.15.187
- IP address: 10.6.15.93
The SN-ALERT-Timeline-msg table holds answers to another question from the quiz: What is the family of malware involved for each infection?
As we can see from the above screenshot, the first column of the table represents the alert.signature that was triggered, so we can summarize that the malware families involved for each of the infections were:
- Cobalt Strike, Flicker Stealer, and Hancitor for IP address: 10.6.15.119
- Qbot (Qakbot) for IP address: 10.5.15.187
- Agent Tesla for IP address: 10.6.15.93
Thanks to the first seen column on the same table, we can easily answer another question from the quiz: On which date and what time did the infection activity begin in UTC?
The answers to this question can be found on the First Seen column of the SN-ALERT-Timeline-msg table:
- Jun 16, 2021 @ 17:37:12.171 for IP 10.136.0.119
- Jun 16, 2021 @ 18:42:58.523 for IP 10.136.0.187
- Jun 16, 2021 @ 18:46:32.684 for IP 10.136.0.93
NOTE: Depending on your timezone, Kibana will adjust the timestamp of the events/alerts. In order to see them in UTC, you need to set Kibana’s timezone to UTC. To do this, you need to:
- 1. Login to Kibana and navigate to the "Kibana" -> “Advanced Settings” tab.
- 2. Click on the "Advanced Settings" option in the left-hand menu.
- 3. Scroll down to the "Timezone for date formatting" setting and select Etc/UTC from the dropdown menu.
- 4. Click on “Save changes”.
Now let’s have a look at the SN-KRB5-AccountLogins table. This table is very important as it can show us really valuable information from the KRB5 logs in Suricata (“event_type”:”krb5” in eve.json). It basically represents Kerberos account login data and the columns in the table provide the following information:
- - src_ip.keyword: This column shows the IP address of the client that initiated the Kerberos login request.
- - krb5.cname.keyword: This column shows the client principal name, which is the name of the user or service account that initiated the Kerberos login request.
- - unique count of krb5.cname.keyword: This column shows the number of unique client principal names that have logged in during the specified time period.
Overall, the table provides a view of the Kerberos account logins produced by Suricata that have occurred on the network during a specific time period. It can be used by network administrators to monitor and analyze Kerberos authentication activity, identify any suspicious logins or potential security threats, and ensure that users and services are accessing network resources securely and as intended.
Before we look more in depth at that however, let’s look at the KRB5 protocol, the CNAME, and the protocol logs that Suricata produces based on inspecting the network related to KRB5/Kerberos.
Kerberos is a network authentication protocol that is used to authenticate users, computers, and services in a network environment. It is commonly referred to as the KRB5 protocol, which stands for Kerberos version 5.
The KRB5 protocol is designed to provide secure authentication and authorization services for client/server applications over an insecure network, such as the internet. It uses symmetric key cryptography and relies on a trusted third-party authentication server, called the Key Distribution Center (KDC), to authenticate users and provide them with a ticket that can be used to access network resources.
When a user wants to access a network resource, they first request a ticket from the KDC. The KDC authenticates the user and issues a ticket that contains a session key that is used to encrypt and decrypt messages between the client and the server. The ticket is then presented to the server, which verifies the ticket and grants the user access to the requested resource.
The KRB5 protocol is widely used in enterprise environments and is supported by many operating systems, including Windows, macOS, and Linux. It provides strong security features and helps to prevent unauthorized access to sensitive network resources.
In the context of the Kerberos authentication protocol, a CNAME (Canonical Name) is a type of principal name that identifies a user or service account within the Kerberos realm. It is a human-readable string that is used to represent the principal name, which consists of two parts: the primary component and the instance component.
The primary component of the CNAME typically identifies the user or service account by name, while the instance component is used to differentiate between different instances of the same principal. For example, a user principal might have a CNAME of "alice@EXAMPLE.COM", while a service principal might have a CNAME of "HTTP/webserver.example.com@EXAMPLE.COM". In this example, "alice" is the primary component of the user principal, while "HTTP/webserver.example.com" is the primary and instance components of the service principal.
The CNAME is an important part of the Kerberos authentication process, as it is used to identify the client and server principals during ticket requests and ticket granting. When a user or service account requests a ticket from the Kerberos Key Distribution Center (KDC), the CNAME is included in the request and is used to authenticate the principal and grant them access to the requested network resources.
The SN-KRB5-AccountLogins table will help us identify the host names and user account names of the infected Windows computers thanks to the protocol logging produced by Suricata.
So, the key to solving the next two questions lies in the SN-KRB5-AccountLogins table.

As it can be seen on the screenshot, we can easily identify and crossmatch the hostname and account name per IP address, which are as follows:
- IP Address: 10.6.15.119; hostname: DESKTOP-NIEE9LP; user account: tommy.vega
- IP Address: 10.6.15.187; hostname: DESKTOP-YS6FZ2G; user account: horace.maddox
- IP Address: 10.6.15.187; hostname: DEKSTOP-A1CTJVY; user account: raquel.anderson
Another interesting question from the quiz asks us to find out the mac addresses of the infected Windows clients. We can do this by filtering on the IP address of each of the clients. Let’s take 10.6.15.119 as an example. In order to apply the IP filter, you need to go on the SN-ALERT-Timeline-msg table, hover over the IP address and click on the plus magnifier.
This way, we make sure to have results that are only relevant to the client IP 10.6.15.119.
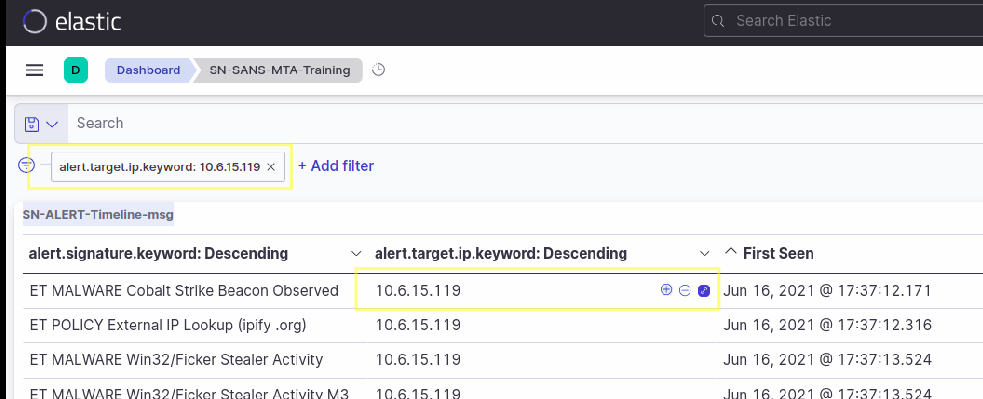
Next, you can scroll down to the SN-ALL-EventsList table and simply unfold the first alert from the table

After you unfold the alert, you can choose between a table, or a json layout/view of the alert. From there, we can easily identify the source and destination MAC addresses, which are present in the "ether" field/object.

So the answer to this question is:
- IP 10.6.15.93 source MAC address is 00:23:54:a2:1f:b4
- IP 10.6.15.119 source MAC address is 00:23:54:e3:a3:55
- IP 10.136.15.187 source MAC address is 00:23:54:72:c9:13
Using SELKS for forensic analysis
So now we have answered the whole quiz just by looking at a ready to use dashboard in Kibana – based on SELKS – that uses and showcases Suricata network protocol logs, flow data, and alerts.
Thus, the SELKS SN-SANS-MTA-Training Dashboard proves to be an essential tool for forensic investigators. Its advanced analytical capabilities, customizable visualization tools, and real-time network security monitoring provides forensic investigators with the critical information they need to identify and respond to key security events quickly and efficiently.
Solving the questions from the quiz highlights the effectiveness of SELKS as a comprehensive open source network security solution, and underscores the importance of having the right tools and expertise to respond to today's ever-evolving cyber threats. As organizations continue to face complex security challenges, SELKS is a powerful resource for protecting against cyber threats and ensuring the security and integrity of critical data.
For the purpose of solving the quiz, you can use the following open source tools:
- SELKS, which can be installed on docker on most Linux machines
- Kibana dashboards, which can be installed on any ELK stack

